Football Intelligently: GNN Expected Goals
A graph neural network that models players as nodes and their spatial interactions as edges to value shots from StatsBomb 360 freeze frames, reaching 95.7% of StatsBomb's proprietary xG using only free, open data.
- Role
- Solo: research + engineering
- Model
- HybridGATv2 + temperature scaling
- Data
- StatsBomb 360 · 326 matches · 7 comps
- Status
- MIT Sloan paper in progress
0.760
Shot xG AUC
95.7%
Of StatsBomb's proprietary xG
8,013
Shots modeled
0.148
Brier score
Premise
A shot is a relationship, not a coordinate.
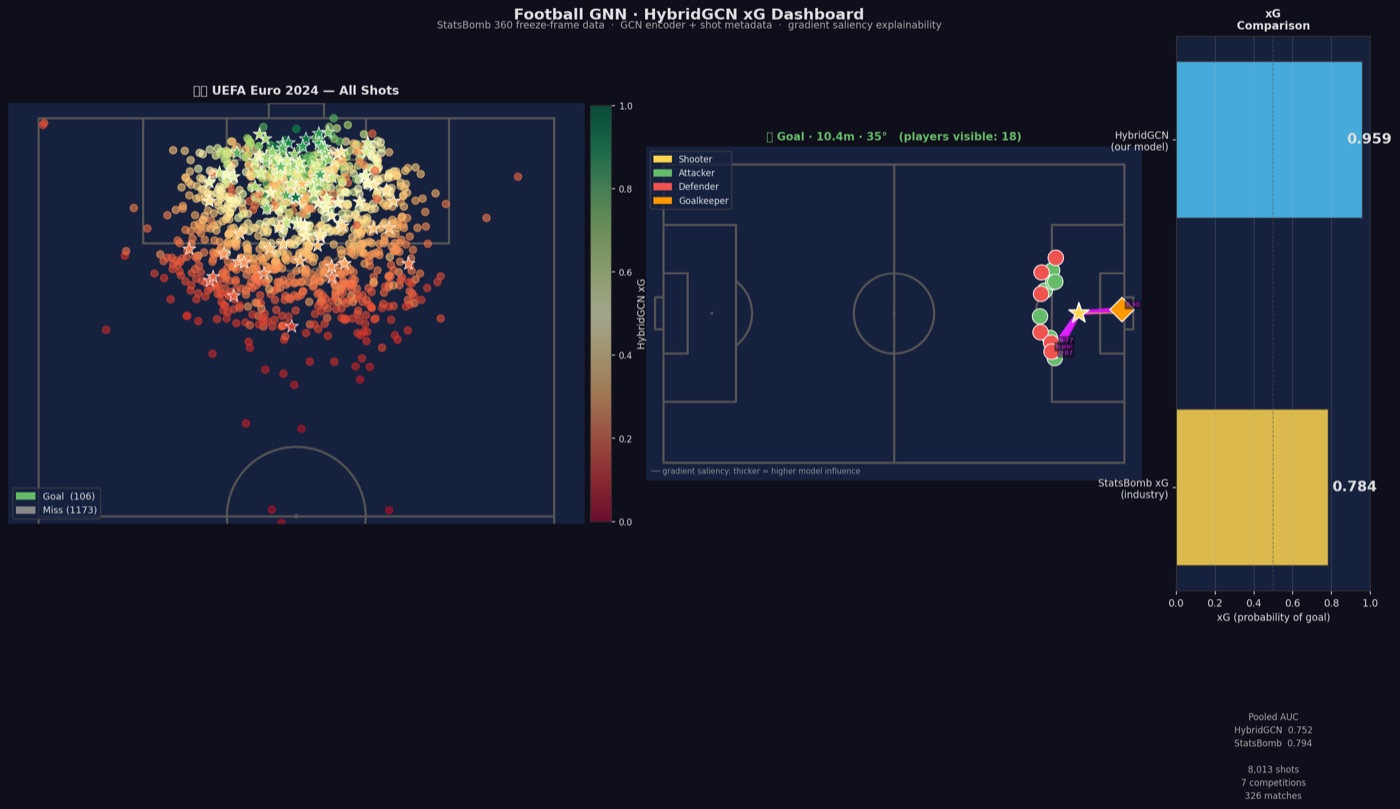
Classic expected-goals (xG) models treat a shot as a handful of scalar features: distance, angle, body part. But whether a shot goes in depends on where every other player is standing. I modeled each shot as a graph, players as nodes and their spatial interactions as edges, so the model can reason about defensive shape and goalkeeper positioning as relational structure.
Model
HybridGATv2 on freeze frames.
The production model is a HybridGAT+T: a GATv2 graph-attention network over the StatsBomb 360 freeze frame, fused with 27 dimensions of shot metadata (post-shot xG placement, goalkeeper geometry, defensive blocking, foot preference), with per-competition temperature scaling for calibration. It scores AUC 0.760 and a Brier of 0.148 on 8,013 shots across seven competitions.
Result
95.7% of a proprietary model, on open data.
The model reaches 95.7% of StatsBomb's proprietary xG AUC using only free, open data, validated across men's and women's competitions (World Cups, Euros, Bundesliga). Permutation importance across 12 feature groups showed goalkeeper distance dominates (+0.223 AUC when shuffled), ahead of shot distance and the header flag.
Dashboard
An interactive analyst tool.
The dashboard turns the model into something an analyst can use: shot maps coloured by model xG, a shot inspector with gradient-saliency and attention overlays showing which players the model attended to, calibration and reliability diagrams, full match reports with cumulative xG timelines, and a "surprise goals" view that surfaces sub-15% xG strikes.
Why it's here
Research rigor, shipped.
Five novel contributions are confirmed against the literature, and a paper targeting the MIT Sloan Sports Analytics Conference is in progress. It is the side of me that takes an idea from raw open data to a calibrated, evaluated model with an interface, not just a notebook.